Key employee engagement statistics
- Global, 20% engaged. Gallup’s annual estimate for January to December 2025. Global data summary
- United States, 29% engaged. Gallup’s Q3 2026 US employee survey, released October 2026. US quarterly update
- United Kingdom, 10% engaged. Gallup’s pooled estimate for 2023–2025, published April 2026. UK country data
Use each figure with its geography and period attached. The estimates use different time windows and sampling designs, so a side-by-side ranking would obscure important differences.
Global employee engagement trends
Gallup’s global annual series fell from 23% in 2023 to 21% in 2024 and 20% in 2025. These observations come from the same report series and can be read as a trend in the published estimates. Gallup global data summary
The 2026 report draws primarily on the Gallup World Poll and includes additional US working-population samples. 2026 report and methodology
United States employee engagement
Gallup classified 29% of US employees as engaged in Q3 2026, down from 31% in the previous quarter. These are quarterly estimates for adults working full or part time for US organisations. Gallup’s October 2026 release
In Gallup’s separate annual series, engagement averaged 31% in both 2024 and 2025, compared with 36% in 2020. Compare those annual averages with one another and read the quarterly update on its own timescale. Gallup’s US annual trend
United Kingdom employee engagement
Gallup puts UK employee engagement at 10% in the 2023–2025 rolling window. The previous window ending in 2024 also showed 10% at the published precision. Adjacent windows share observations, so this is stability in the rounded rolling estimates. Gallup UK country data
UK Civil Service engagement index
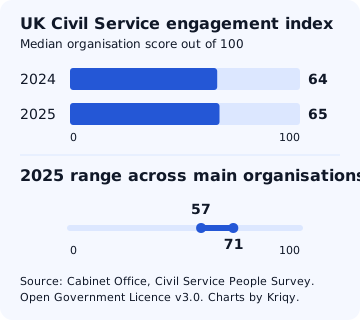
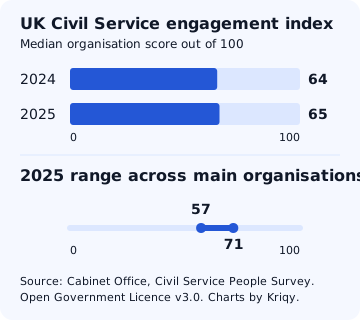
The Cabinet Office reports a benchmark index of 65 in 2025 and 64 in 2024 on a 0–100 scale. This five-question index uses the full response scale. It is a sector-specific benchmark and measures something different from Gallup’s share classified as engaged. Cabinet Office results · Scoring methodology
| Measure | Index out of 100 |
|---|---|
| Benchmark by year | |
| 2024 | 64 |
| 2025 | 65 |
| 2025 range for main organisations | |
| Lowest | 57 |
| Highest | 71 |
What happens after employees give feedback?
In the 2026 CIPD Good Work Index, 41% rated their manager positively at seeking the views of employees or their representatives, while 36% rated them positively at responding to suggestions. Both measures describe employees’ perceptions. The figures do not track what happened to individual suggestions. CIPD Good Work Index, figure 41
To measure follow-through in your own organisation, record the decision, assign an owner when work is agreed, and tell employees what changed or why a request cannot be acted on. Use follow-up feedback to check whether the response addressed the original concern. Employee feedback-loop closure criteria · Survey action-plan template
Research methodology and limitations
- Gallup engagement. These are classifications based on Gallup’s engagement instrument. Its US series uses a probability-based panel and web surveys. Its UK country result pools three years. Published percentages are rounded estimates subject to survey error. Gallup measurement notes
- Cabinet Office index. The survey covers participating Civil Service organisations. The benchmark is the median organisation score. The index uses five engagement items and differs from the survey’s separate theme scores. Civil Service methodology
- CIPD employee voice. YouGov fielded the online UK Working Lives Survey from December 2025 to February 2026. Figure 41 reports ratings from 4,588 respondents who were not self-employed. It measures perceived manager behaviour and cannot establish causation or verify that suggestions were implemented. CIPD report and survey information
When citing a number, include the original publisher, population, measure and field period. Use the original sources linked above as the authority for the data.